Objective
Develop a comprehensive tool that serves as a centralized repository for all the insights collected by our regional teams. These insights encompass topics like: audience behavior, brand loyalty, and the overall performance of TikTok campaigns.
Challenge
The global TikTok strategy team has accumulated a wealth of insightful datas from the regional teams, however, these insights are only shared in regional presentations and are scattered across various internal TikTok documents. This fragmentation makes it challenging to access and utilize the data effectively.
Solution
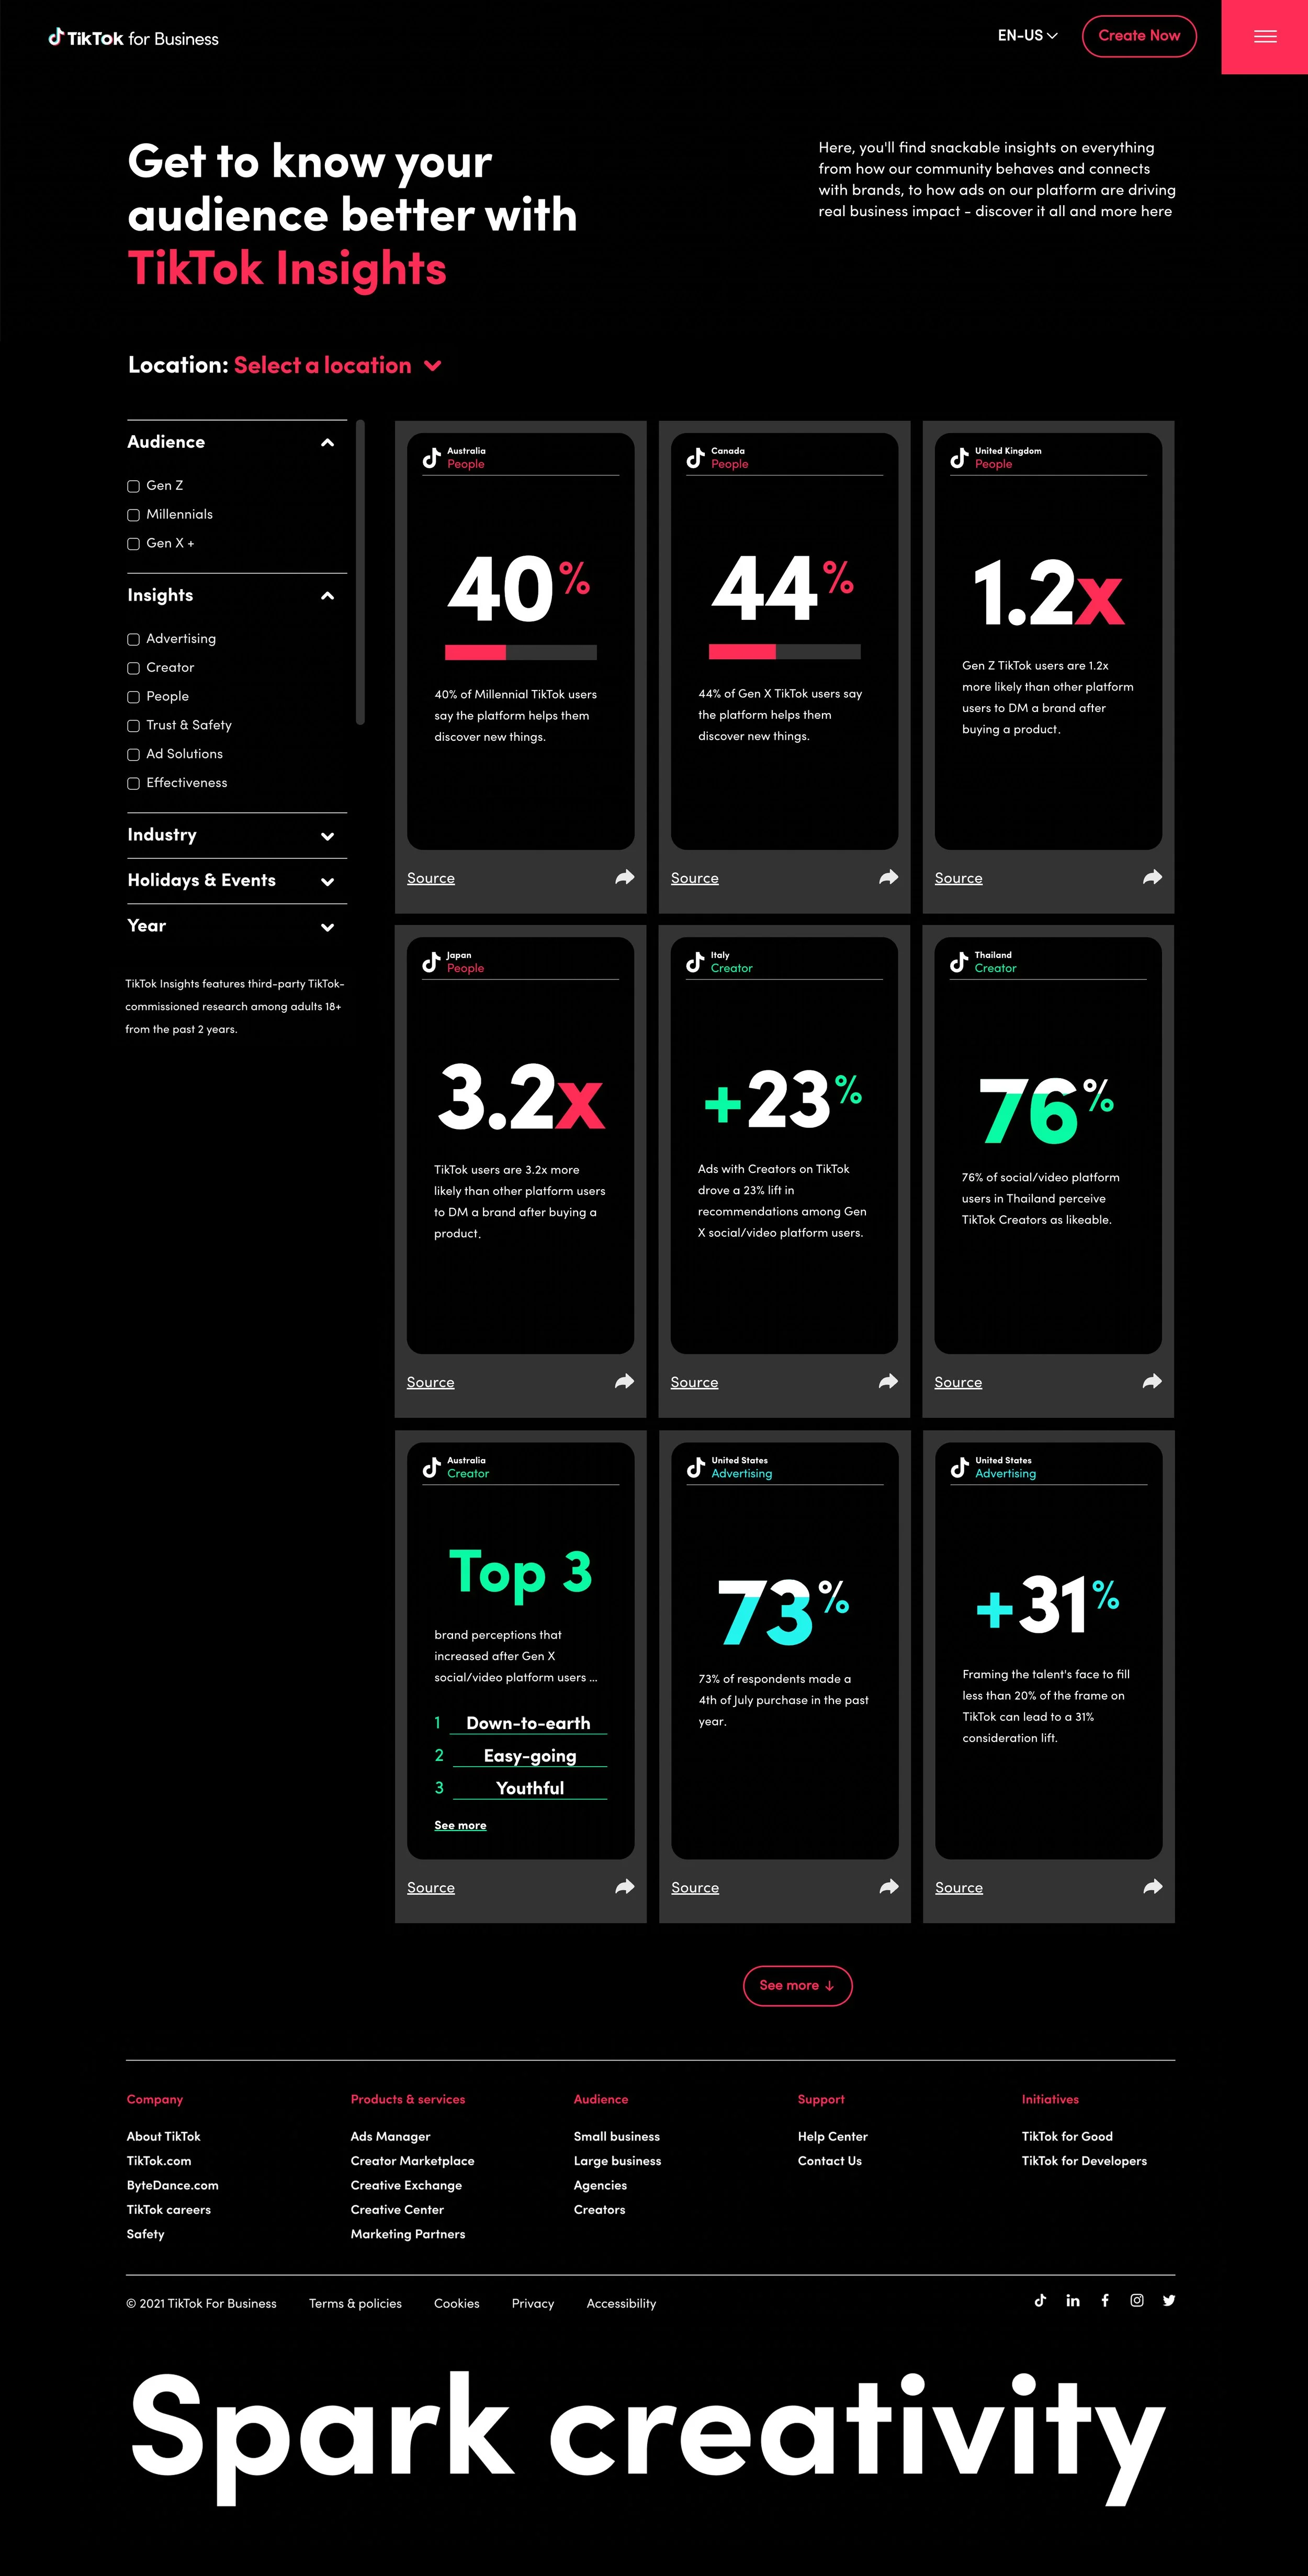
We’ve decided to create an interactive platform integrated within the TikTok For Business website, to host all the insights gathered from the regional teams. Its purpose is to empower the public to delve into valuable data that can help inform their marketing decisions.
With TikTok Insights, users have the ability to filter and customize their search based on various criteria such as regions, target audiences, specific insights, and events. This flexibility allows marketers to easily access and analyze the data that is most relevant to their target markets.
Preview tool: TikTok Insights
Wireframes
When designing for the website, we considered the placements of the navigations and stats designs. After discussing with the team, we decided to go with the vertical navigation approach with the possibility of adding more categories in the future. In terms of new content recommendations, we left it out from the initial site build to ensure users’ focus was on the search of insights. Discovery portion will be moved to the next phase of the site build.
Design
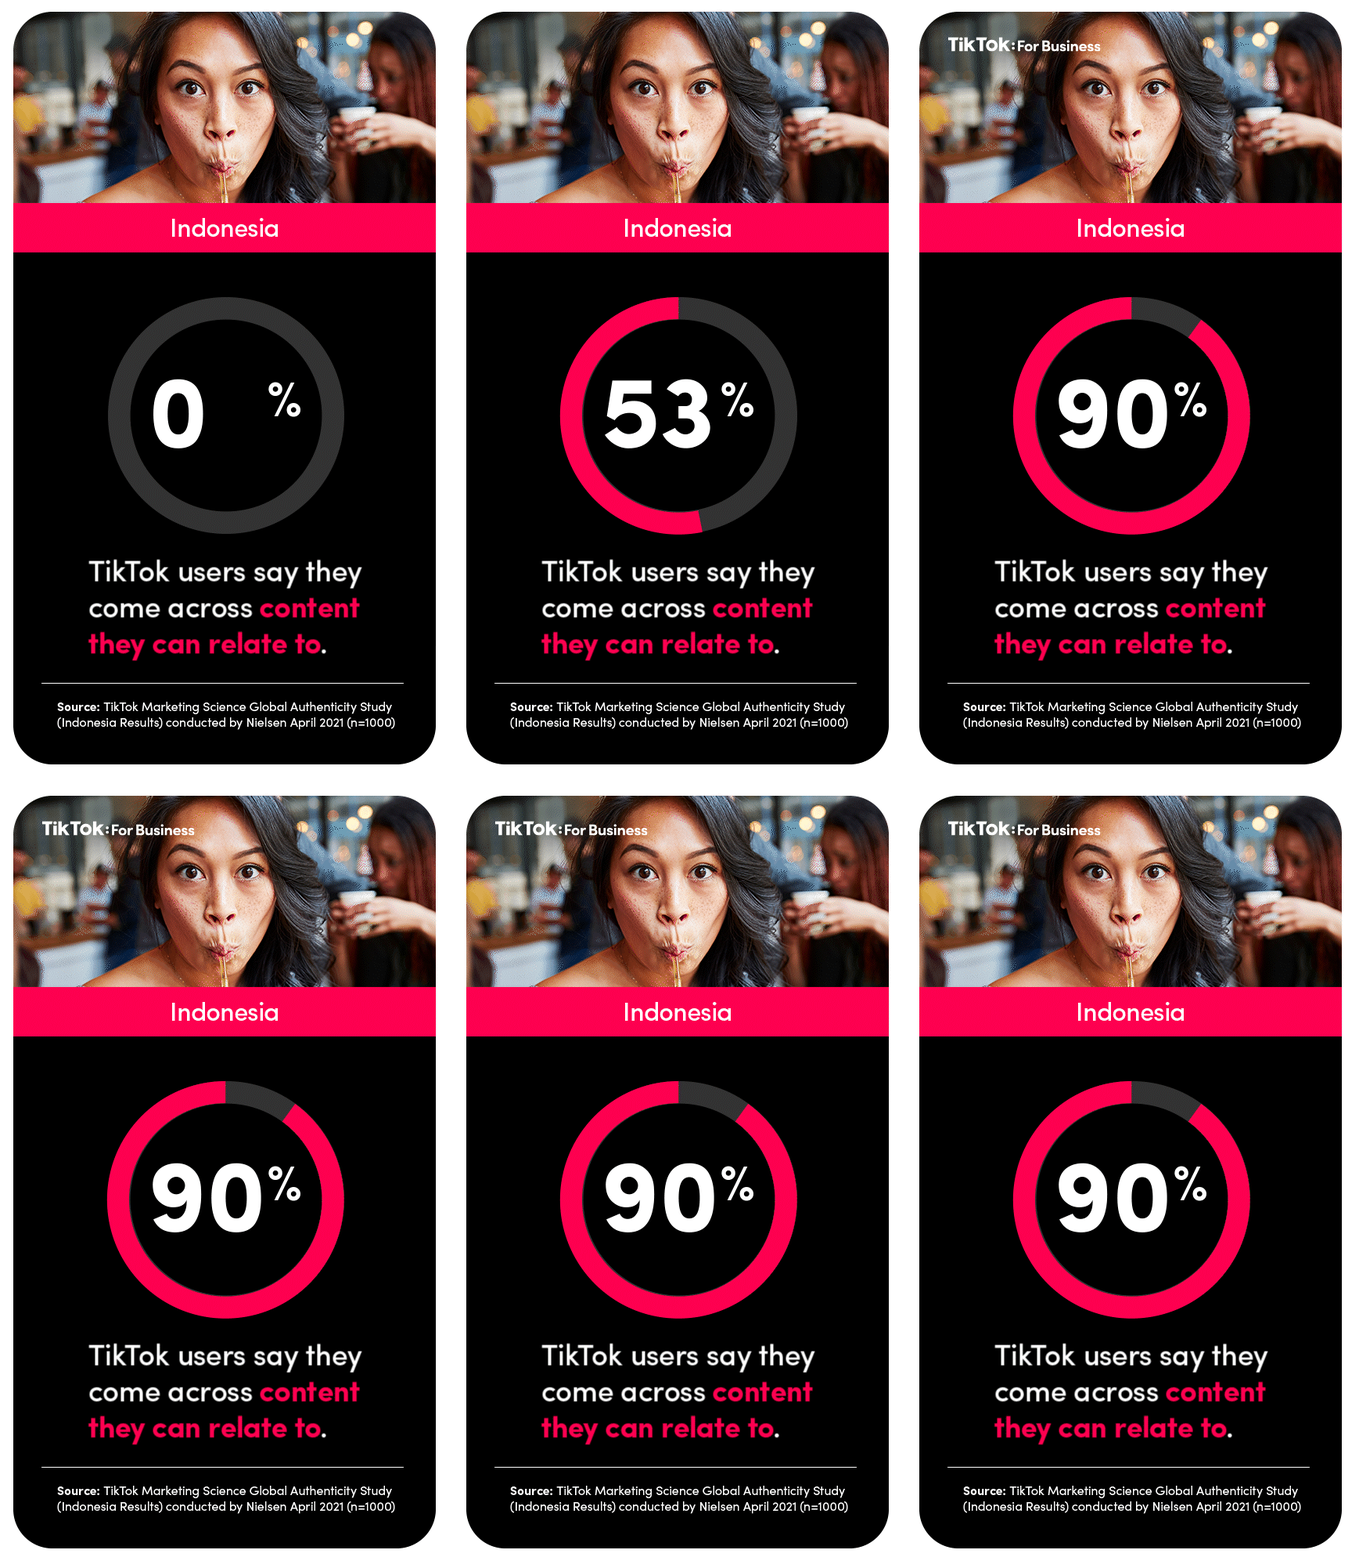
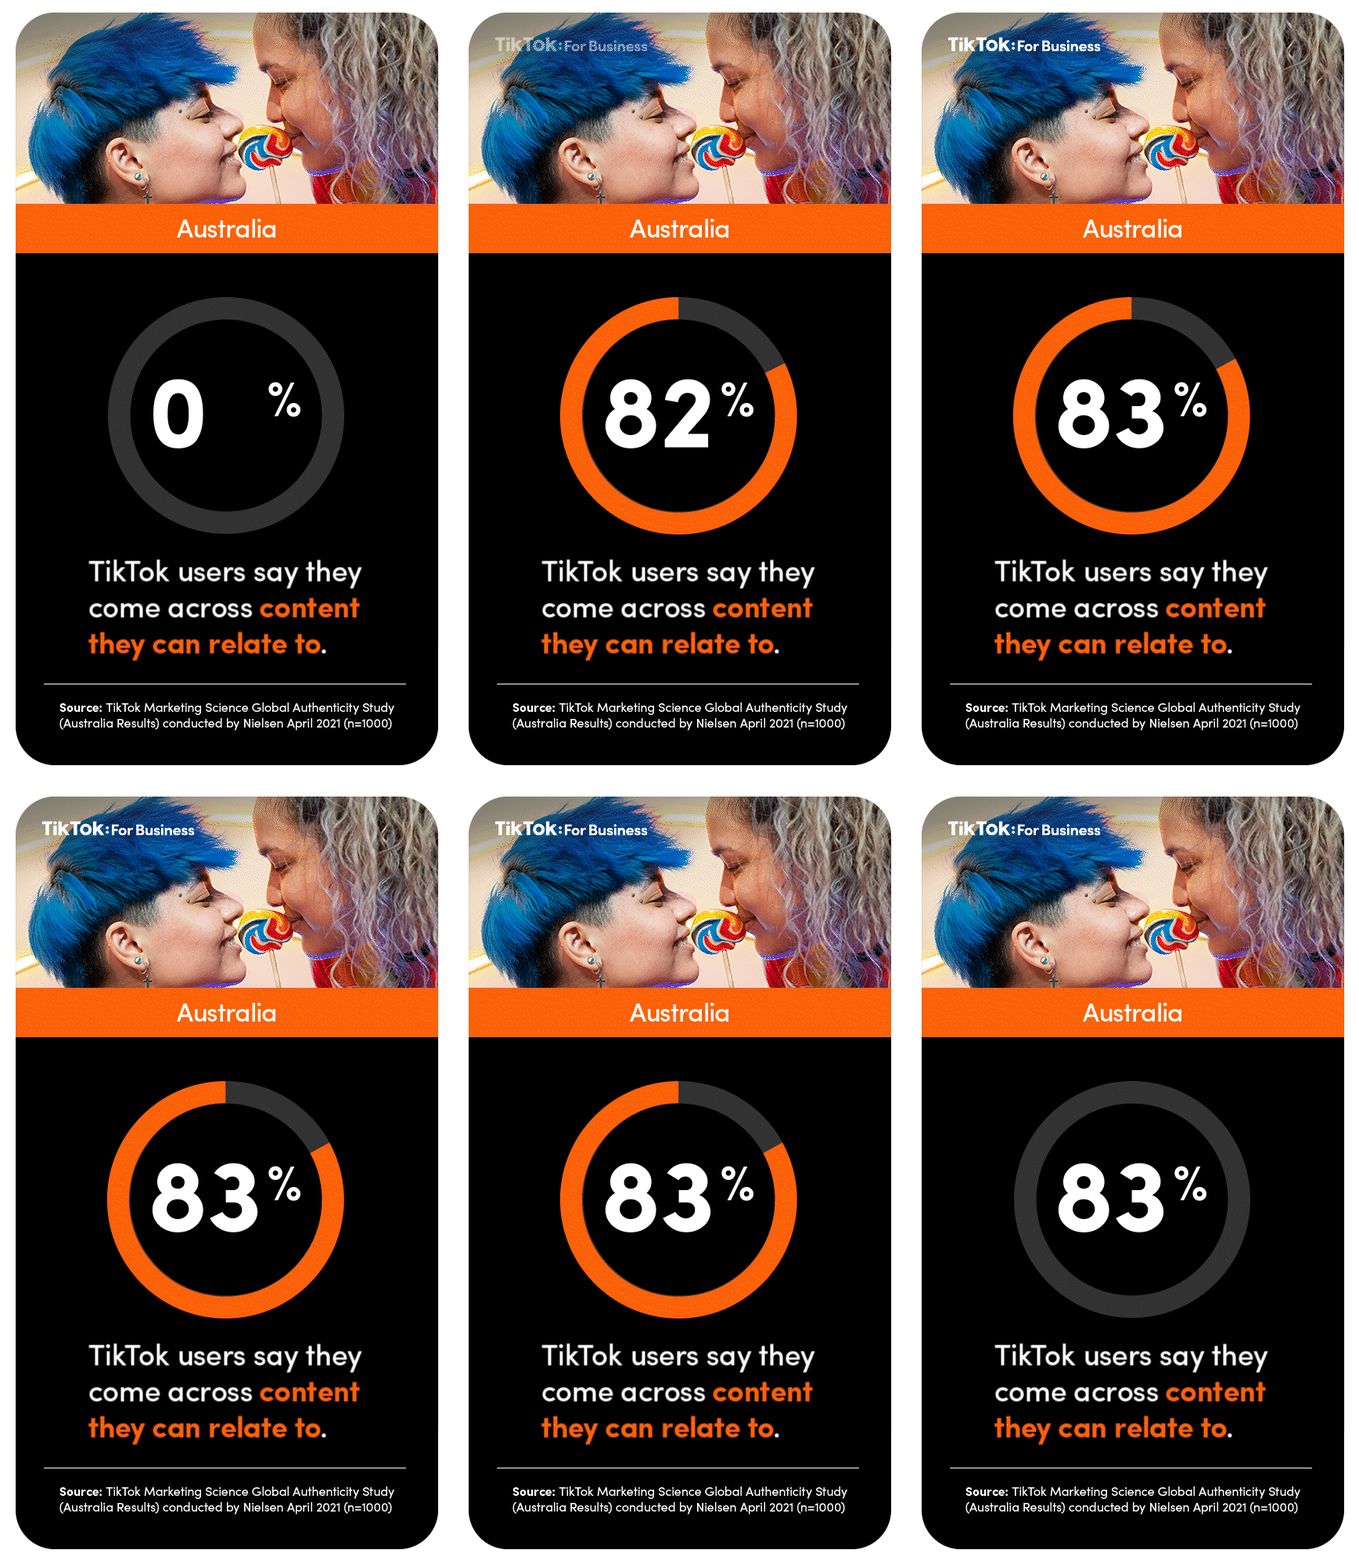
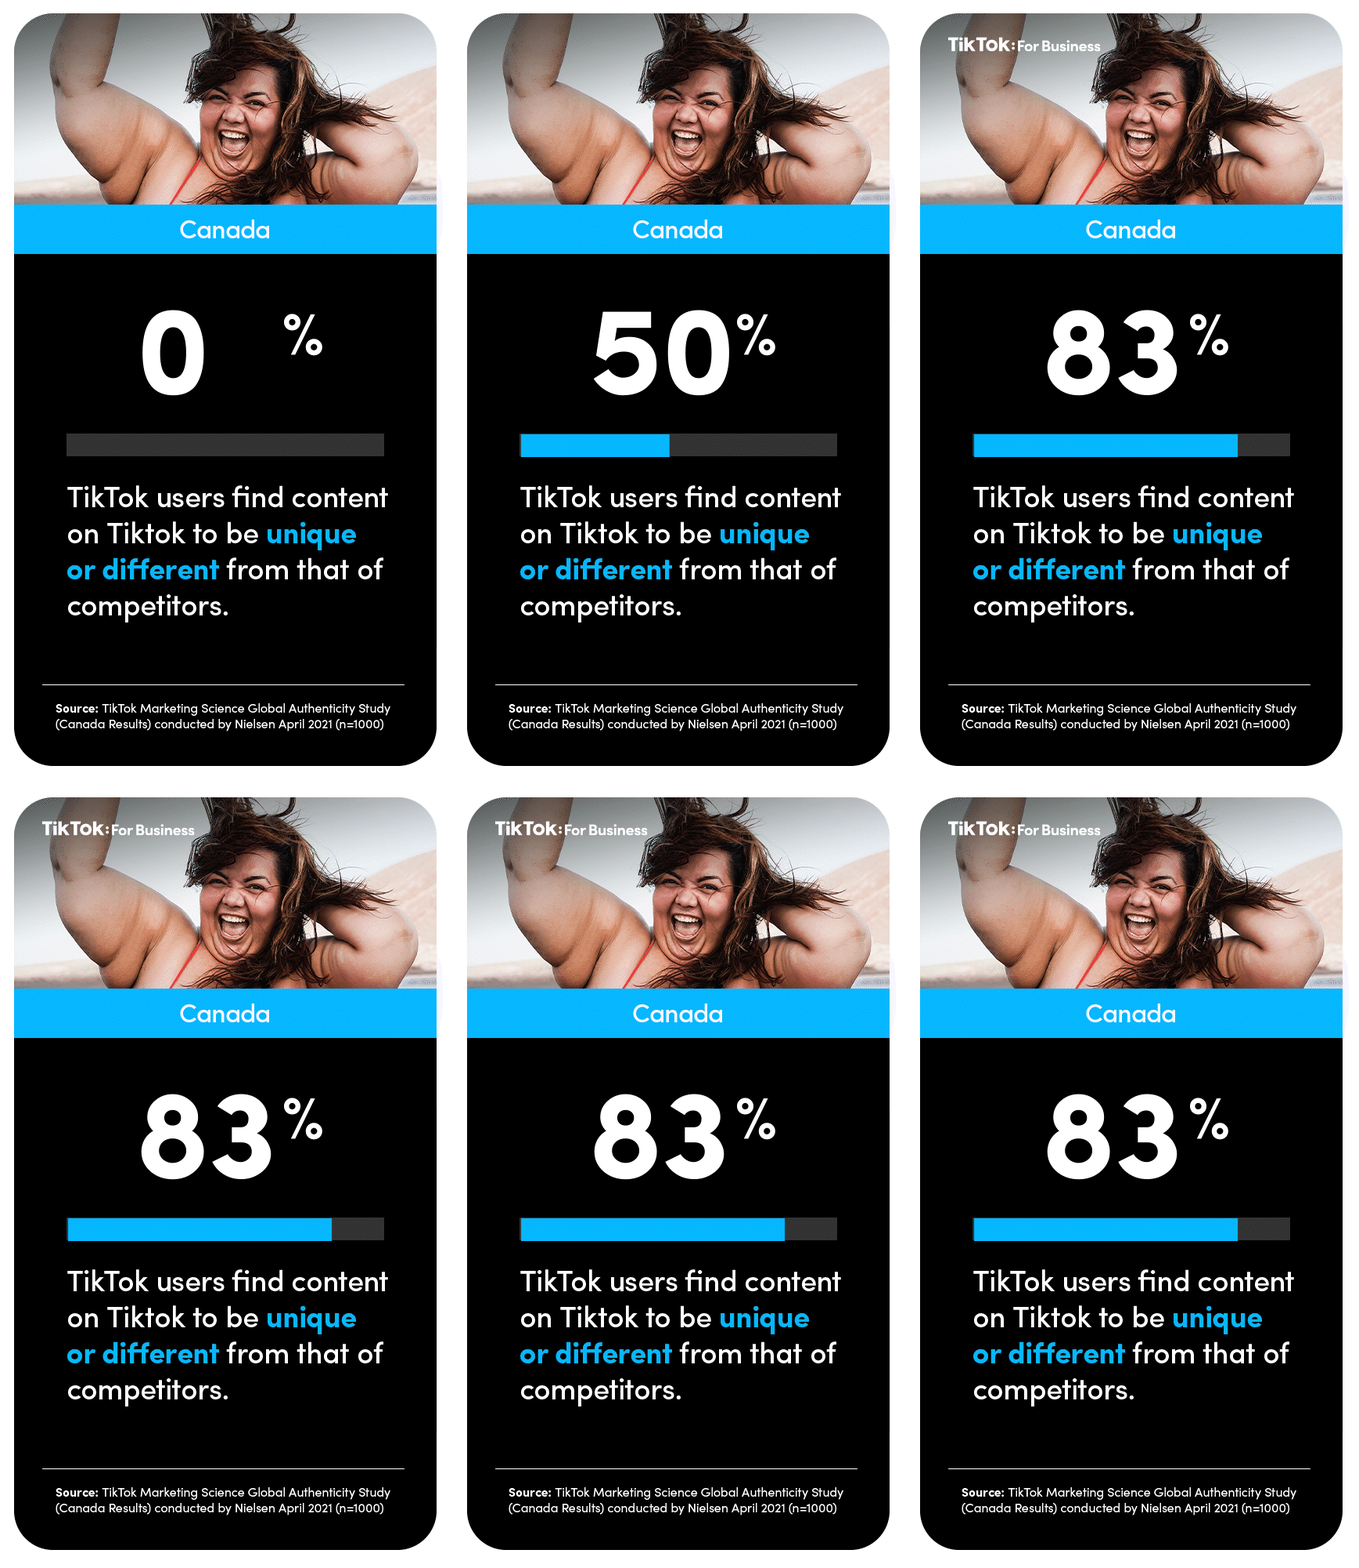
Stats card designs animations
In our initial design phase, we planned to include animation and images into the stats designs. However, after considering the loading speed, we decided to keep the cards static. All the animated and image cards are used only in blog posts or marketing materials.
Results
TikTok Insights was launched on the TikTok website in July 2022. Since then, it has garnered significant user engagement. On average, users spend approximately 4.25 minutes on the website, showcasing interaction rate of 85%. Remarkably, the tool has become the most frequently visited page on the TikTok website. The feedback received from marketers has been positive, with a majority acknowledging that the insights helped them make better decisions when advertising on TikTok.
Seen in Cannes Lion 2022
Future vision
Harnessing AI technology for enhanced data insights: As our data insights grow from various regions, we recognize the potential of AI technology to unlock valuable connections within the datasets. By leveraging AI algorithms, we can uncover patterns and correlations, allowing our database to continuously generate more insightful data. This empowers our internal teams and marketers with a wealth of information, enabling them to make data-driven decisions.
Personalized insights through algorithmic recommendations: We are committed to keeping our users informed and engaged with the latest insights. To achieve this, we are implementing an advanced algorithm that tailors recommendations to each user's preferences. At the top of our website, a dedicated section will be curated specifically for our users. Based on their previous filters and viewing history, the algorithm will suggest relevant insights that align with their interests, enabling users to easily explore new content.
Implementing CMS for internal team: To facilitate a more efficient insights upload and alleviate the burden on our engineering team, it is crucial to develop a CMS platform for our Strategy team. This platform should enable our internal to easily input new stats, select relevant categories, and choose card designs/colors.
Previous Project: Re:Tech POS system
Next Project: Re:Tech Merchant Essential App


